


Oshawa Power customers experienced 83% less downtime than the average customer in Ontario.
In 2024, Oshawa’s local electric grid posted one of our best years on record and we’re excited to share the highlights with you. This year, we once again posted a near-perfect reliability score, ensuring that power continued flowing to your homes and businesses with minimal interruption. While our team’s hard work on system upgrades and grid management have laid the foundation for this success, we have to admit — we also got a little lucky with the weather and fewer unexpected challenges than we’ve experienced in the past. 🍀
Let’s dive into some key numbers and take a look at what made 2024 such a strong year for our system’s reliability:

Reliability Score: 99.99%
Just like our customers have come to expect, we once again posted a near-perfect Reliability Score of 99.99%, or what is known as ‘four nines’ in our industry, the golden standard for reliability.
While we came even closer to a 100% score in 2024, realistically near-perfect is the best that we can aim for. Through our long-term planning, our team has made significant upgrades to our local electricity grid including investing in building one of Ontario’s leading SmartGrids (approx. 40% of Oshawa’s grid is integrated), replacing aging infrastructure, and developing programs to mitigate animal and tree contact outages. These strategies have laid the foundation for one of Ontario’s most reliable local grids but can never protect our infrastructure from external risk factors like extreme weather, lightning, or motor vehicle accidents.
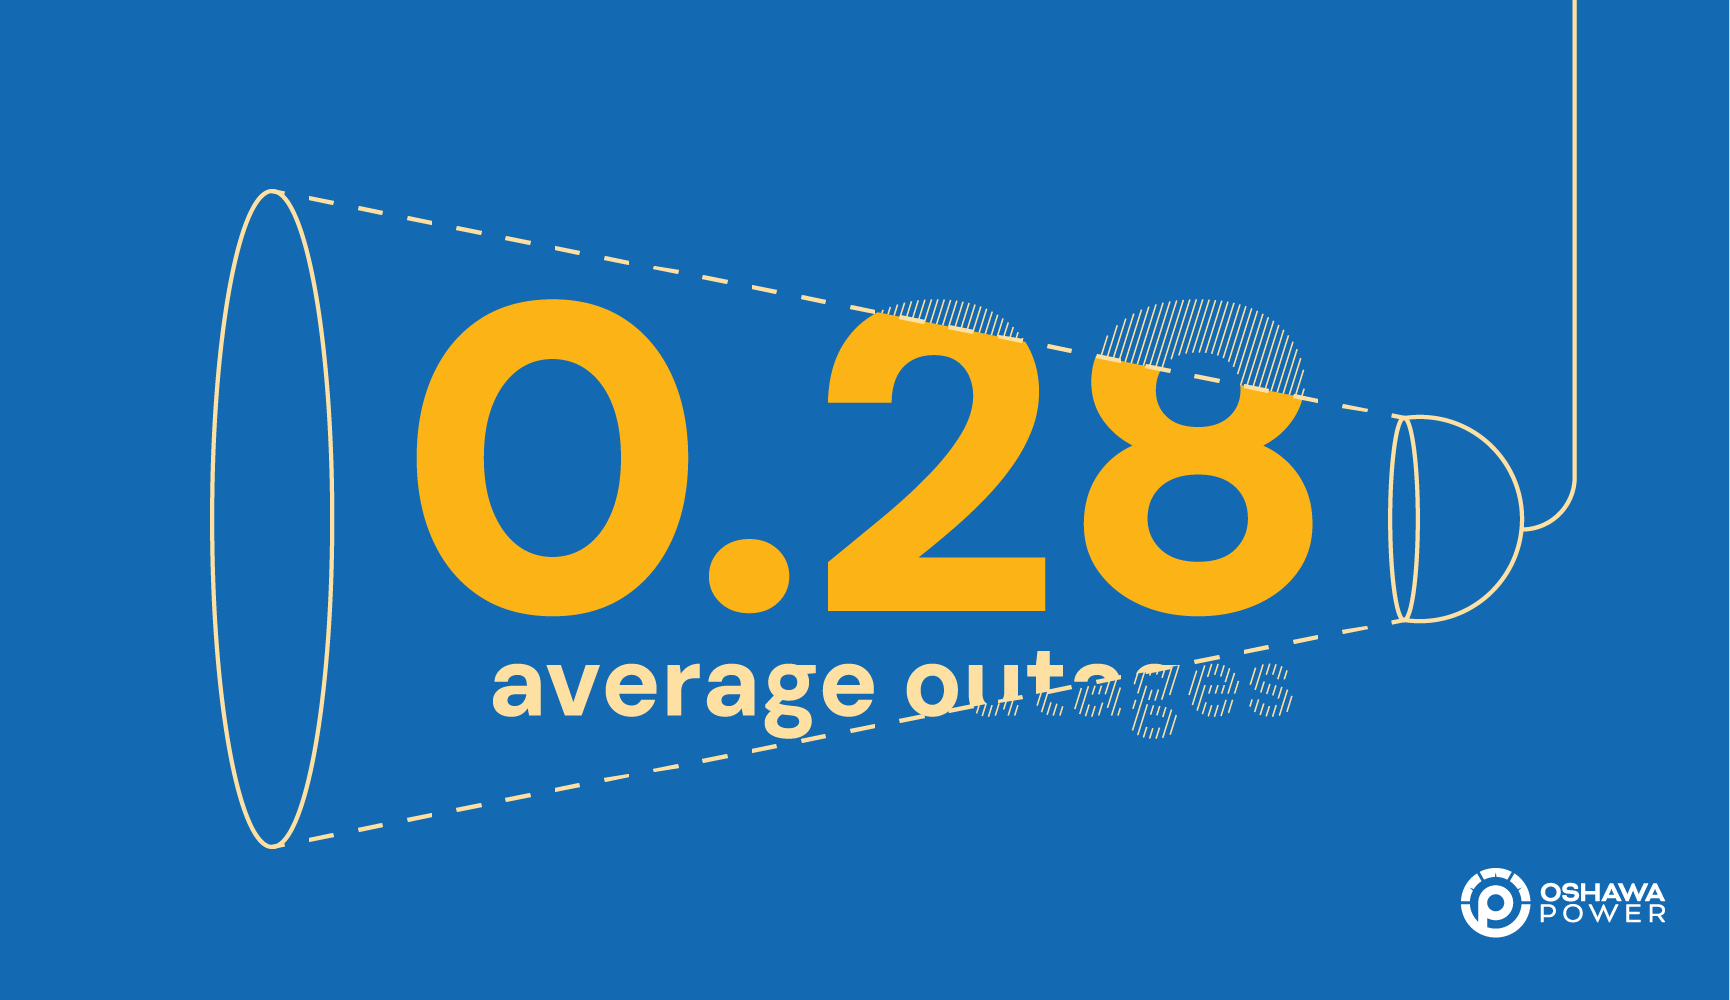
Average Number of Outages: 0.28
Based on our System Average Interruption Frequency Index (SAIFI) metric, Oshawa Power customers experience just 0.28 outages in 2024.
What does this number mean? This metric means that approx. 3 in 4 Oshawa Power customers didn’t experience a single outage during the past year!
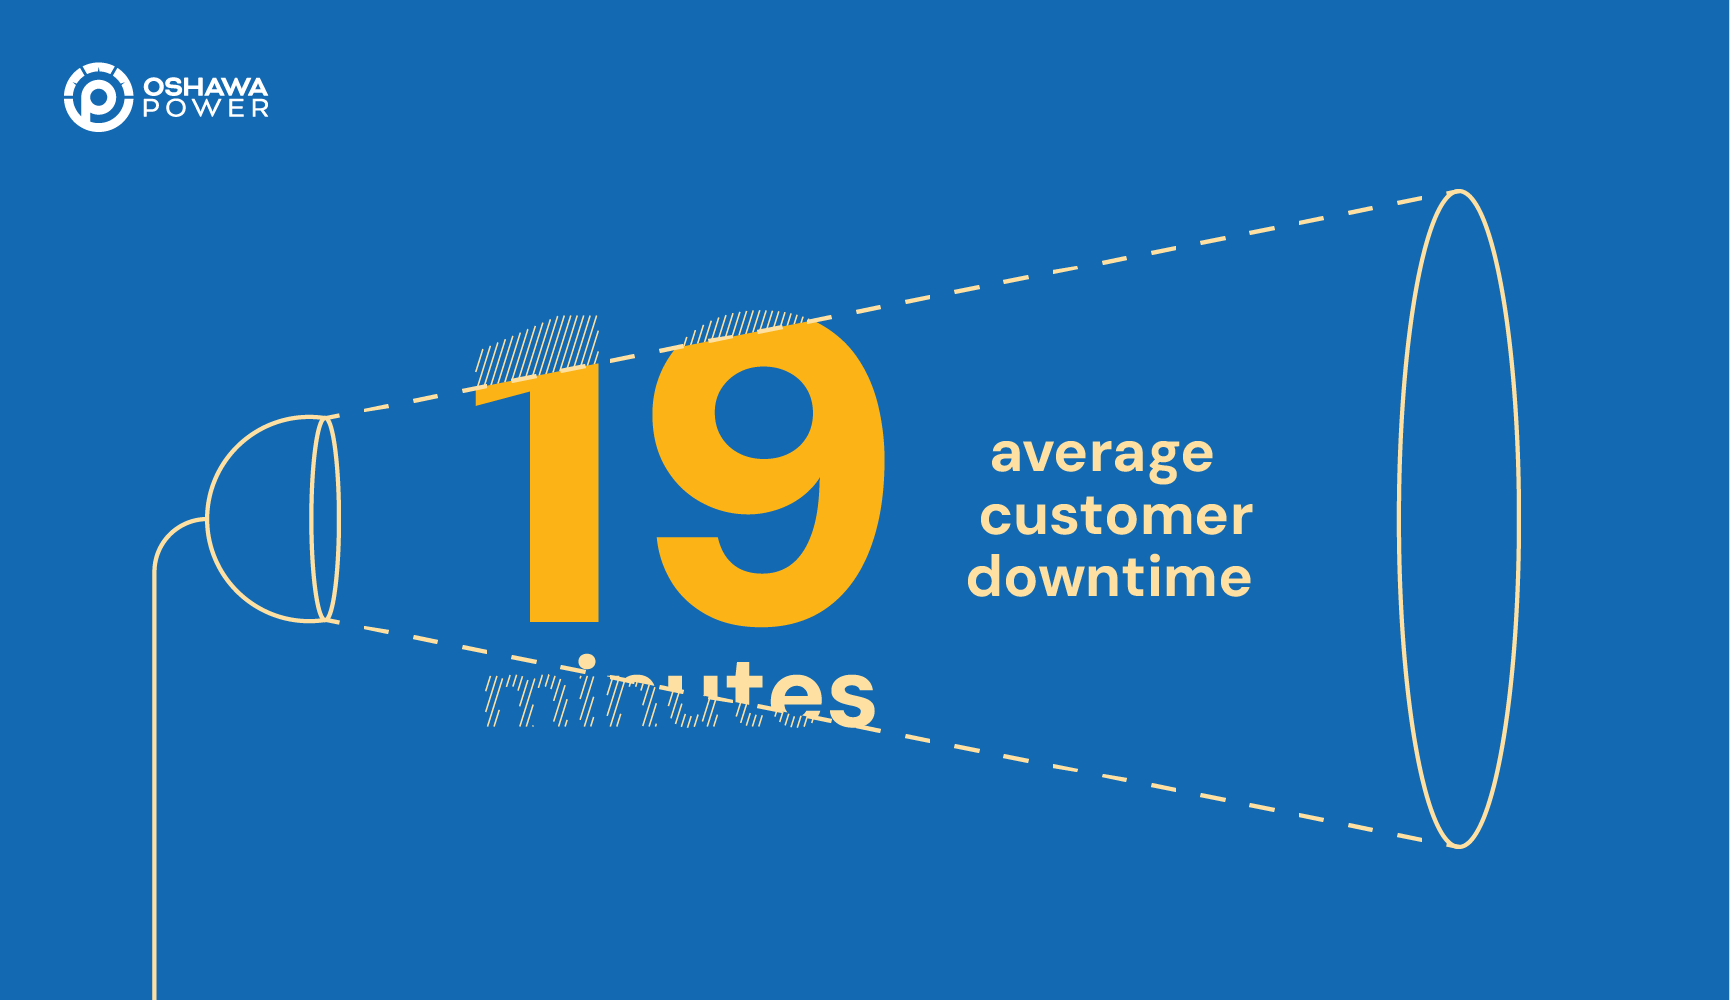
Average Yearly Downtime: 19 Minutes
In 2024, we surpassed 63,000 customers. From the smallest bachelor apartments to large manufacturing plants, actual downtime and outages experienced throughout the year varies. But on average, the residents and businesses that call Oshawa home experienced an average of just 19 minutes in the dark.
Oshawa Power customers experience much less downtime than the Ontario average:
| Year | Oshawa Power | Ontario Avg. |
|---|---|---|
| 2024 | 19 | – |
| 2023 | 48 | 110 |
| 2022 | 88 | 160 |
| 2021 | 34 | 151 |
| 2020 | 88 | 163 |
| 2019 | 59 | 158 |
| 2018 | 80 | 155 |
| 2017 | 44 | 171 |
| 2016 | 157 | 167 |
| 2015 | 73 | 167 |
Ensuring that our city doesn’t get left in the dark is fundamental to our success. Not only is this measure important to us but based on your feedback from our 2024 Customer Priority Survey, this is what matters most to you. We were proud to post our best performance on record during 2024!
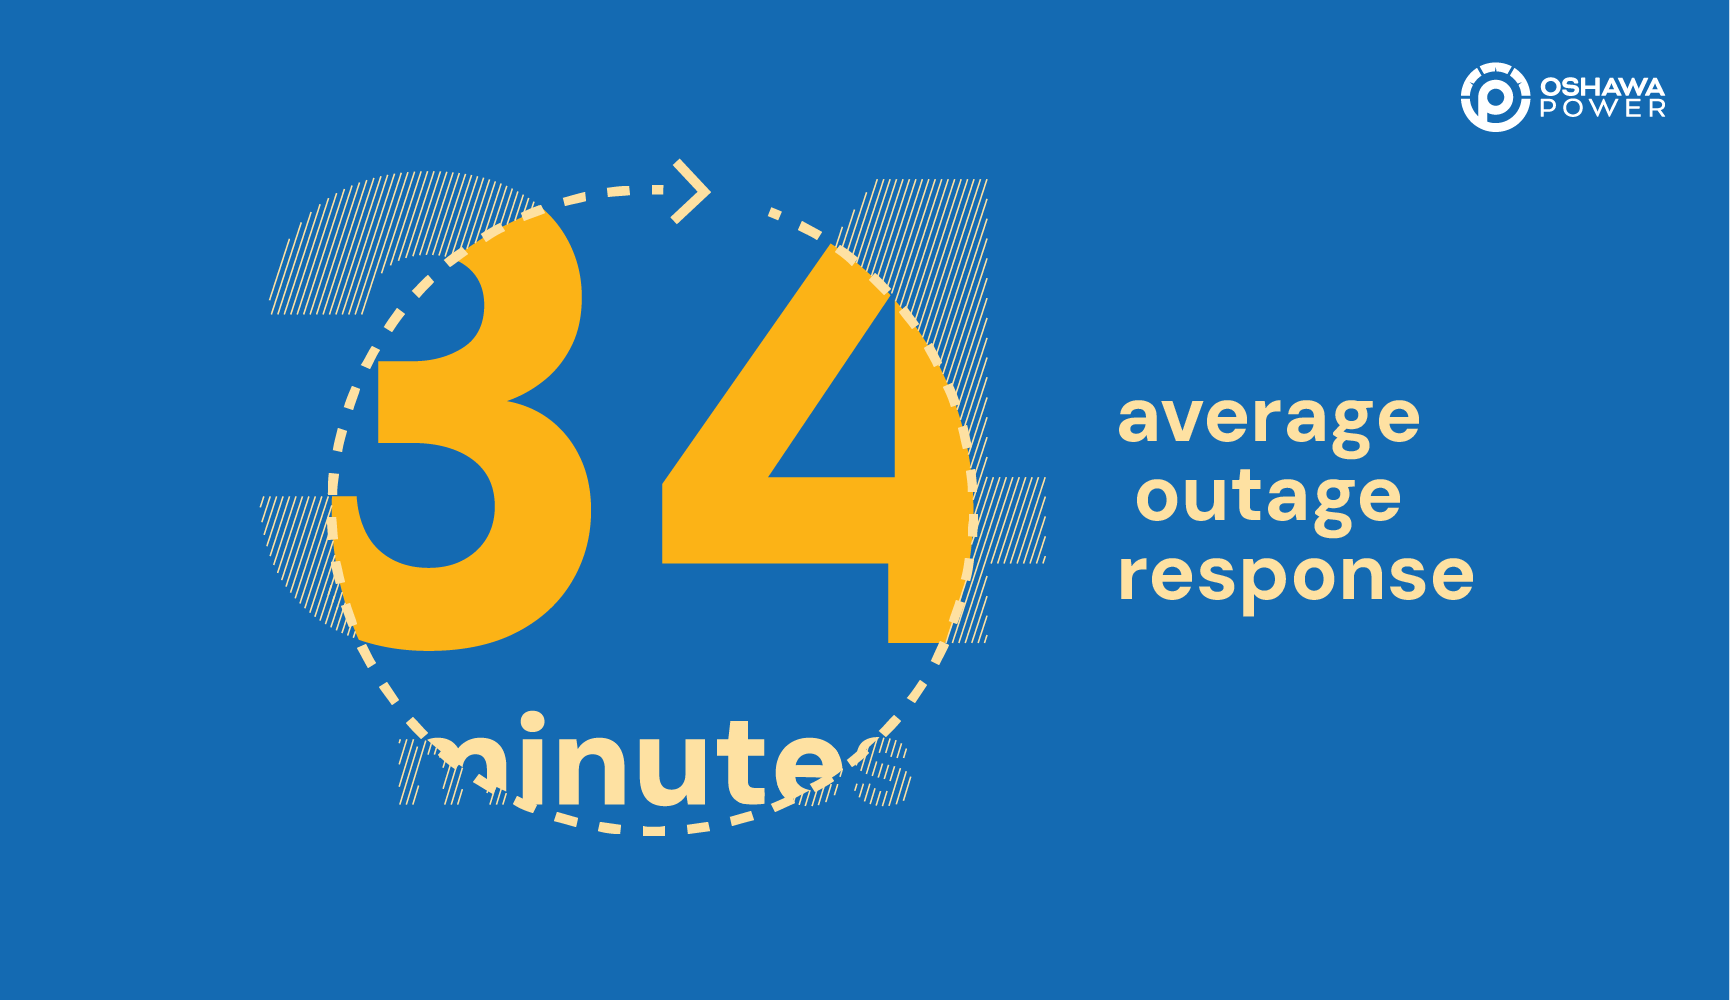
Outage Response Time: 34 Minutes
When the power goes out, you count on us to act. In 2024, our team’s response averaged just over half an hour.
You may have noticed that this is higher than previous years. Last year, we adjusted how we measure our response time to more accurately account for the time it takes to be onsite to begin restoration of a sustained outage. Previously, this metric included the automated response to momentary outages and we made this adjustment to increase transparency and provide a realistic expectation for you, our customer. Our 34 minute response time will act as our baseline moving into 2025.
With our team always at the ready, we know that a swift response is crucial to your satisfaction. When an issue occurs and your family is left without power, you can be sure our team is springing into action, from our Control Room to our crews, to investigate, determine the issue, and safely restore power as soon as possible and get your lights back on.
Total Number of Outages: 413
Over the course of the year, our grid saw a grand total of 413 outages ranging from a single service to our largest outage affecting more than 3,300 customers. This number includes all outages, planned and unplanned.
Momentary Outages: 88
Those dreaded brief flickers that knock the power out just long enough to mess with your clocks are what we refer to as ‘momentaries’. And trust us, we know these can be a nuisance, but in reality these are the sign of our grid doing what it is designed to do.
Momentary outages occur when our grid automation is at work to avoid a potentially larger, and lengthier outage. With self healing and isolating technologies expanding across more of our city’s grid, these devices are designed to help us detect outages as soon as they happen and automatically restore service to as many homes as businesses as possible almost instantly. This allows us to isolate the smallest possible area affected by the ongoing issue while our team gets to work on repairs and restoration.
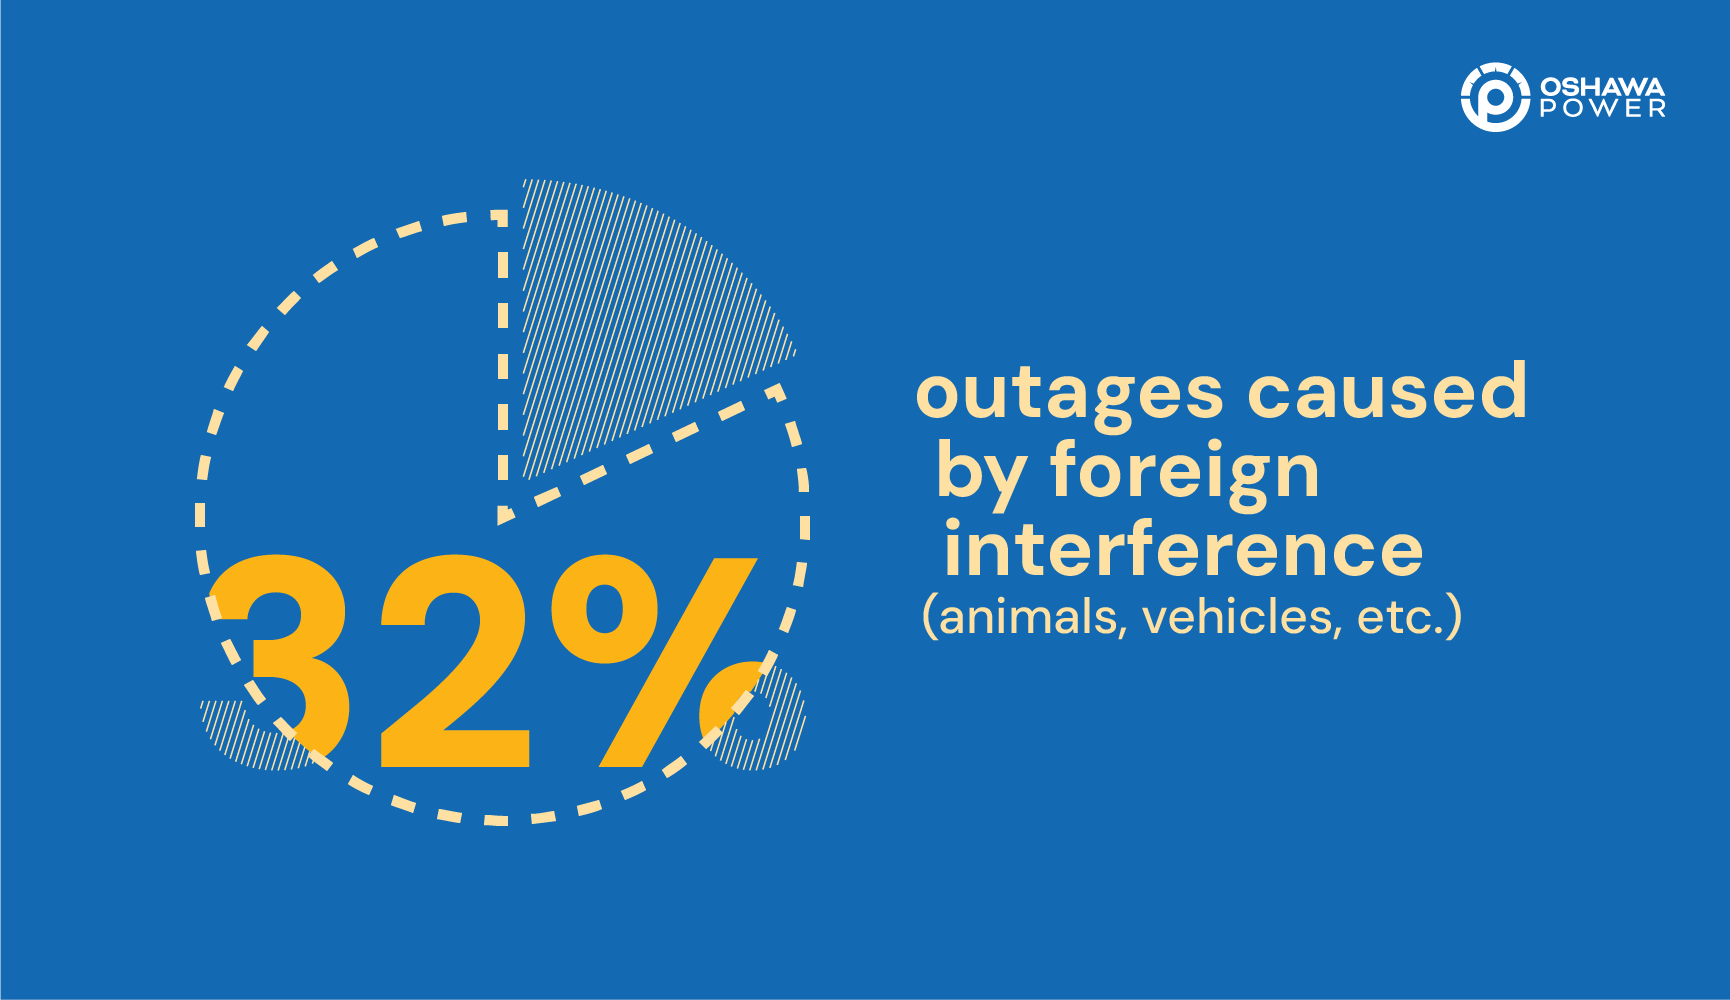
Top Outage Cause: Foreign Interference
In 2024, approximately 32% of all outages were classified as being caused by Foreign Interference:
| Outage Cause | % of Total Outages |
|---|---|
| Foreign Interference | 32% |
| Tree Contact | 29% |
| Equipment Failure | 24% |
| Scheduled Outages | 14% |
| Adverse Weather | 1% |
We know it may sound scary but Foreign Interference is nothing to fret over! This classification captures outages that are caused when an object that shouldn’t be in contact with our infrastructure does make contact, causing a fault and a corresponding outage and includes things like animal contacts and motor vehicle accidents.
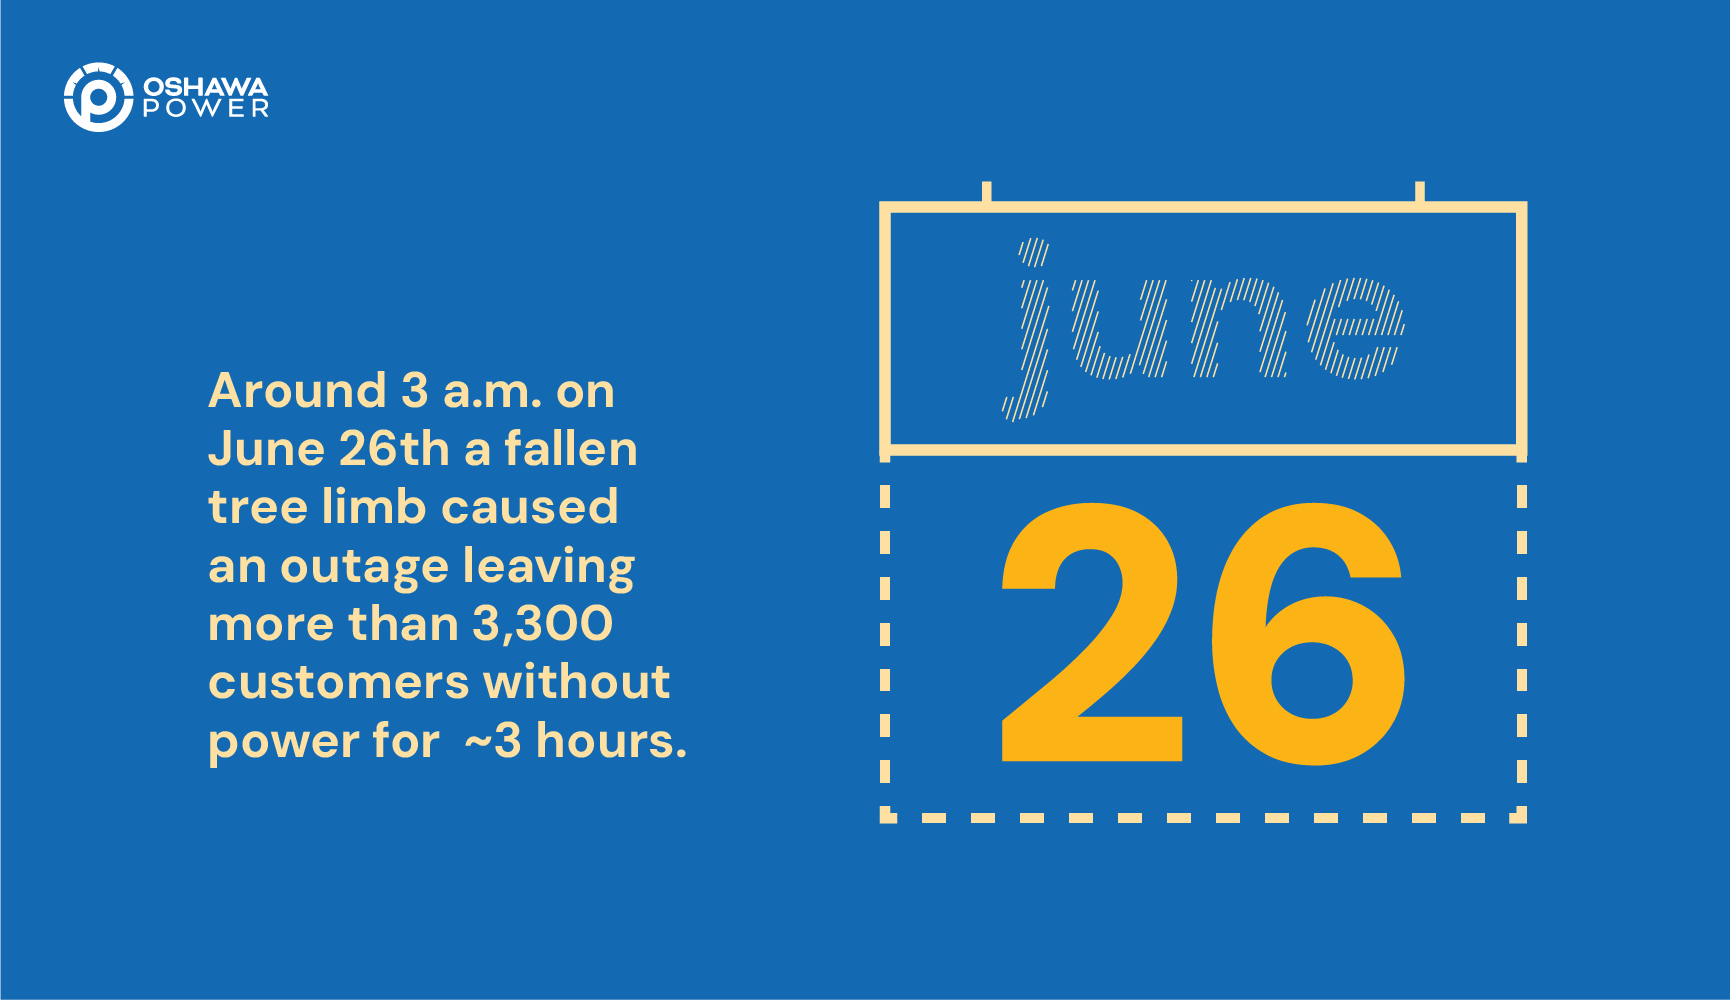
Largest Outage: June 26th (3,303 customers)
The largest outage of the year occurred on June 26th in the wee hours of the morning. The outage was caused by a large tree limb falling on our lines in the area of Ritson Rd. and Given Rd. around 3 a.m. This interference caused a fault that left 3,303 customers without power for almost 3 hours.
Under normal circumstances, our grid would have been able to isolate the issue and automatically restore most customers affected in a short timeframe. However, ongoing maintenance left our system unable to reroute power and isolate the issue, causing an extended outage for all affected customers.
Despite this hurdle, our on call crews jump into action and dispatched to the area. After patrolling the lines and pinpointing the issue, teams went to work on the removal of the limb and repairs to our infrastructure, restoring power to our customers just before sunrise!
Other Notable Outages:
January 1st
We didn’t have to wait long for the first notable outage of 2024. On January 1st a primary cable fault briefly left a small chunk of our city without power. However our team was able to restore service in less than an hour and (luckily!) this outage was not a sign of things to come…
June 10th
After making it through winter and much of the spring without any major events, increasing wildlife activity as we transitioned to summer caused our next notable issue. On June 10th a squirrel made contact with our lines, causing a fault that knocked power out to a large number of customers. Despite the relatively large area affected, the outage didn’t last long as crews were able to complete restoration very quickly!
July 16th
Another tree contact outage, this time our system was operating under normal conditions and was able to isolate the issue, restoring most customers quickly. Crews were once again called into action to remove debris and restore service to the area directly affected.
September 8th
The second largest outage of the year occurred right as the summer was coming to a close. On September 8th a transmission line was dislodged, falling on and becoming intertwined with one of our 44KV lines.
Knocking out a key feeder, this outage left more than 3,000 customers in South and West Oshawa without power. Our crews worked together with the team from Hydro One to clear the fallen line and make repairs, restoring service to most customers in about an hour!
Looking Forward
As we move forward into an increasingly connected future, we understand the role we play in making sure our customers are connected to local grid they can count in. We will continue to pursue advancements to our grid including the further development and implementation of our SmartGrid and additional system upgrades to replace aging infrastructure. In 2025, we will also complete our 3-year Vegetation Management Plan, focusing on Oshawa’s eastern neighbourhoods.
Heading into the new year, we’re not slowing down. We’ll continue investing in technology, upgrading our grid, and finding new ways to make your power even more reliable.
Thanks for trusting us to keep our city’s lights on for more than 130 years. Here’s to another great year together!
To compare how we measure up to LDCs across the province and our own previous performance, check out the OEBs Scorecard Comparison Tool.

